1. Practical work: Character recognition using scikit-learn#
Marc Buffat, Dpt Mécanique, UCB Lyon 1
from Python Machine Learning Tutorial
%matplotlib inline
import numpy as np
import matplotlib.pyplot as plt
# police des titres
plt.rc('font', family='serif', size='18')
from IPython.display import display,Markdown
import sklearn as sk
from validation.validation import info_etudiant
def printmd(string):
    display(Markdown(string))
# test si numero étudiant spécifier
try: NUMERO_ETUDIANT
except NameError: NUMERO_ETUDIANT = None
if type(NUMERO_ETUDIANT) is not int :
    printmd("**ERREUR:** student ID not specified!!!")
    NOM,PRENOM,NUMERO_ETUDIANT=info_etudiant()
    #raise AssertionError("NUMERO_ETUDIANT non défini")
# parametres spécifiques
_uid_    = NUMERO_ETUDIANT
np.random.seed(_uid_)
printmd("**Login student {} {} uid={}**".format(NOM,PRENOM,_uid_))
ERREUR: student ID not specified!!!
Login student Marc BUFFAT uid=137764122
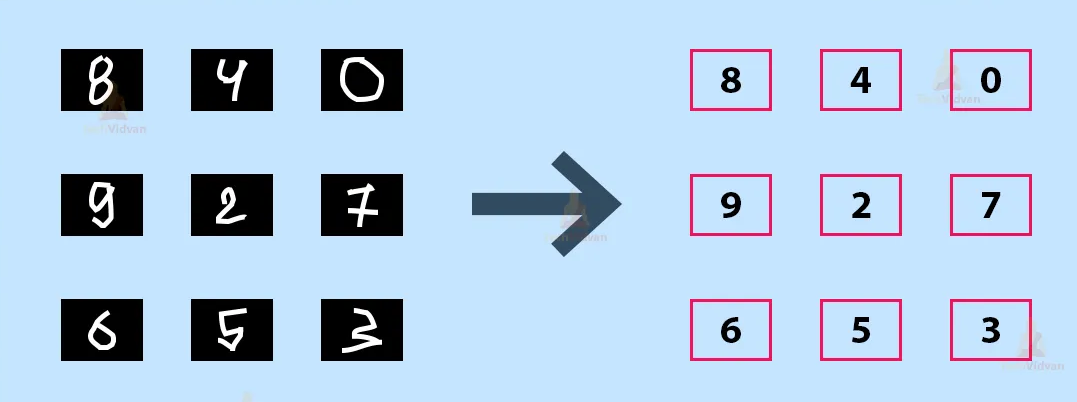
1.1. Principle of image recognition using AI#

1.2. Data base of handwritten digits#
A low resolution version of this data base is available with scikit-learn.
We start by loading the dataset using:
from sklearn import datasets
digits = datasets.load_digits()
# information sur la base de données : dataset
display(Markdown(digits.DESCR))
.. _digits_dataset:
Optical recognition of handwritten digits dataset
Data Set Characteristics:
:Number of Instances: 1797
:Number of Attributes: 64
:Attribute Information: 8x8 image of integer pixels in the range 0..16.
:Missing Attribute Values: None
:Creator: E. Alpaydin (alpaydin '@' boun.edu.tr)
:Date: July; 1998
This is a copy of the test set of the UCI ML hand-written digits datasets https://archive.ics.uci.edu/ml/datasets/Optical+Recognition+of+Handwritten+Digits
The data set contains images of hand-written digits: 10 classes where each class refers to a digit.
Preprocessing programs made available by NIST were used to extract normalized bitmaps of handwritten digits from a preprinted form. From a total of 43 people, 30 contributed to the training set and different 13 to the test set. 32x32 bitmaps are divided into nonoverlapping blocks of 4x4 and the number of on pixels are counted in each block. This generates an input matrix of 8x8 where each element is an integer in the range 0..16. This reduces dimensionality and gives invariance to small distortions.
For info on NIST preprocessing routines, see M. D. Garris, J. L. Blue, G. T. Candela, D. L. Dimmick, J. Geist, P. J. Grother, S. A. Janet, and C. L. Wilson, NIST Form-Based Handprint Recognition System, NISTIR 5469, 1994.
.. topic:: References
C. Kaynak (1995) Methods of Combining Multiple Classifiers and Their Applications to Handwritten Digit Recognition, MSc Thesis, Institute of Graduate Studies in Science and Engineering, Bogazici University.
E. Alpaydin, C. Kaynak (1998) Cascading Classifiers, Kybernetika.
Ken Tang and Ponnuthurai N. Suganthan and Xi Yao and A. Kai Qin. Linear dimensionalityreduction using relevance weighted LDA. School of Electrical and Electronic Engineering Nanyang Technological University. 2005.
Claudio Gentile. A New Approximate Maximal Margin Classification Algorithm. NIPS. 2000.
1.2.1. Data Base#
the results is a generalized dictionary : Bunch (allowing access to the data using key-words)
exploring the data base
data (feature) : images of handwritten digits
results (target) : numerical value: 0,1,2,..9
the data are numerical images of 8x8 pixels in black and white with 16 gray levels (from 0 to 15) (i.e. using 4 bits).
print(type(digits))
print("clés:",digits.keys())
<class 'sklearn.utils._bunch.Bunch'>
clés: dict_keys(['data', 'target', 'frame', 'feature_names', 'target_names', 'images', 'DESCR'])
Print, in the following cell, the value of the first data and the first results (target) in the data base.
print("Data:",digits.data.shape)
print("Results:",digits.target.shape)
### BEGIN SOLUTION
print("premiere donnee brute linéaire:",digits.data[0].shape,type(digits.data[0][0]))
print(digits.data[0])
print("premiere image:",digits.images[0].shape,type(digits.images[0][0,0]))
print(digits.images[0])
print("premier resultat:",type(digits.target[0]),digits.target[0])
### END SOLUTION
Data: (1797, 64)
Results: (1797,)
premiere donnee brute linéaire: (64,) <class 'numpy.float64'>
[ 0.  0.  5. 13.  9.  1.  0.  0.  0.  0. 13. 15. 10. 15.  5.  0.  0.  3.
 15.  2.  0. 11.  8.  0.  0.  4. 12.  0.  0.  8.  8.  0.  0.  5.  8.  0.
  0.  9.  8.  0.  0.  4. 11.  0.  1. 12.  7.  0.  0.  2. 14.  5. 10. 12.
  0.  0.  0.  0.  6. 13. 10.  0.  0.  0.]
premiere image: (8, 8) <class 'numpy.float64'>
[[ 0.  0.  5. 13.  9.  1.  0.  0.]
 [ 0.  0. 13. 15. 10. 15.  5.  0.]
 [ 0.  3. 15.  2.  0. 11.  8.  0.]
 [ 0.  4. 12.  0.  0.  8.  8.  0.]
 [ 0.  5.  8.  0.  0.  9.  8.  0.]
 [ 0.  4. 11.  0.  1. 12.  7.  0.]
 [ 0.  2. 14.  5. 10. 12.  0.  0.]
 [ 0.  0.  6. 13. 10.  0.  0.  0.]]
premier resultat: <class 'numpy.int64'> 0
1.2.2. Display of the images#
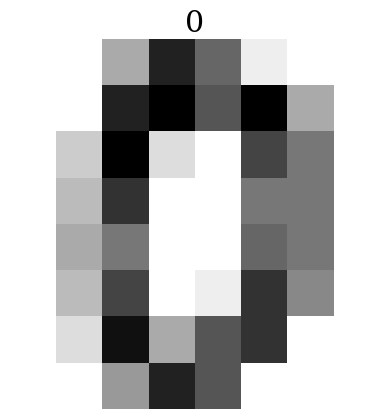
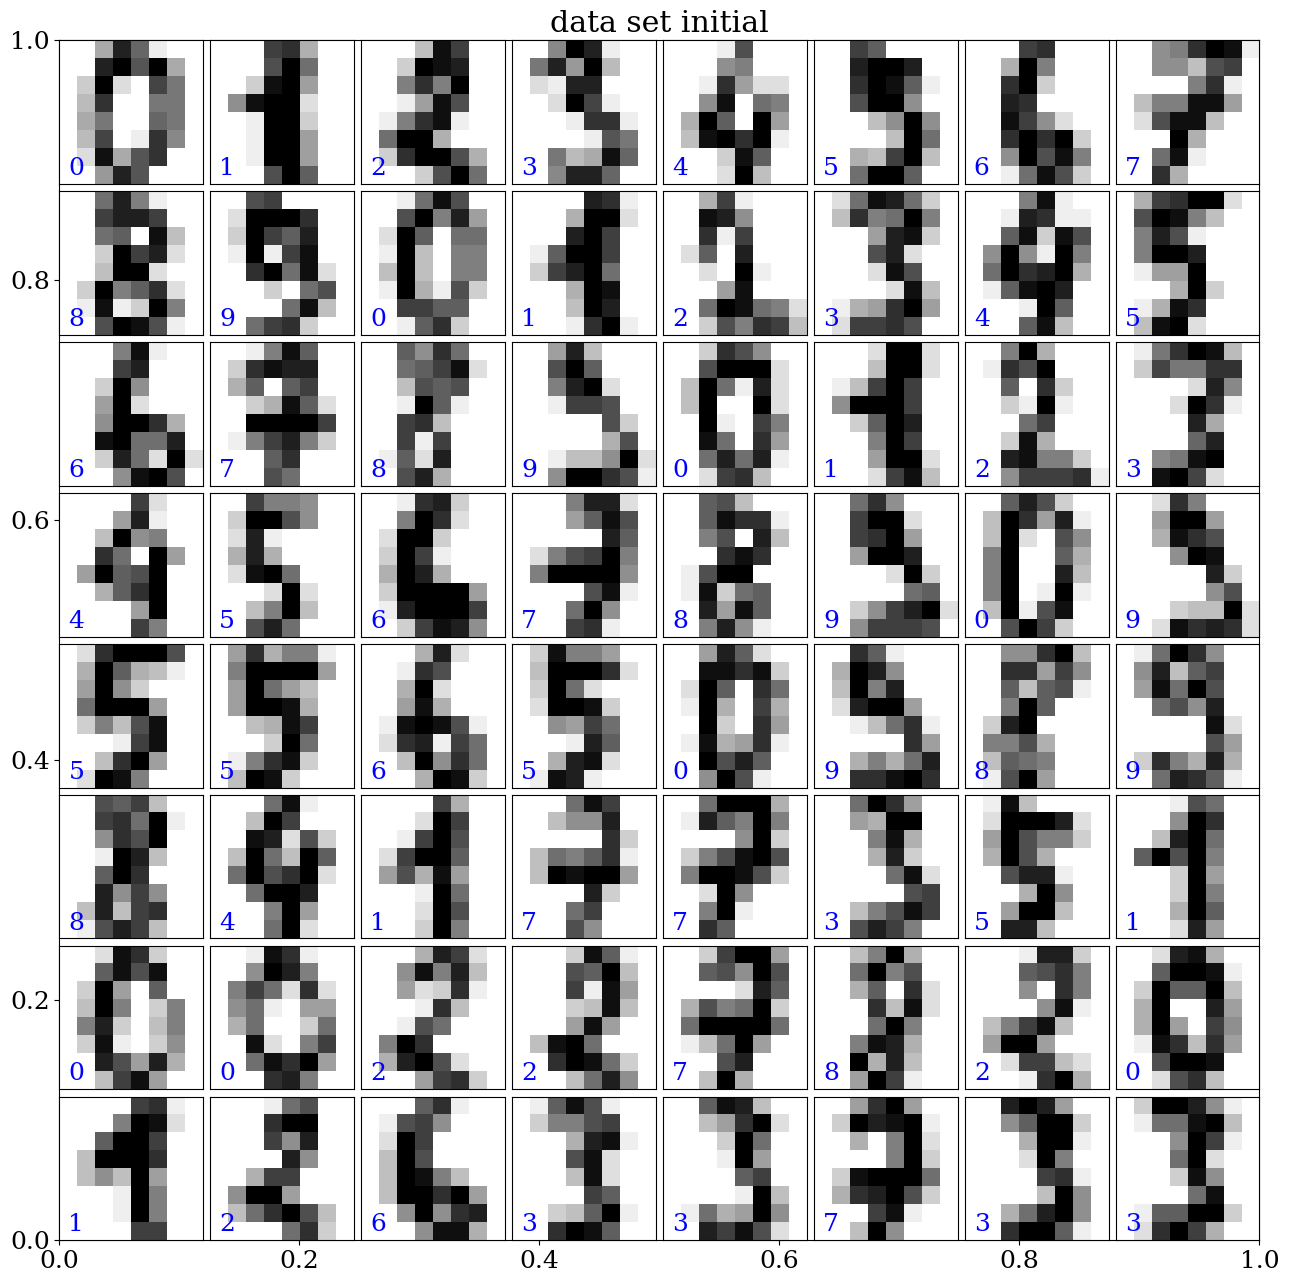
using
imshowto display an imageusing a written python function
plot_datato display a series of nmax images
plt.imshow(digits.images[0],cmap='binary')
plt.title(digits.target[0])
plt.axis('off')
plt.show()
def plot_data(data,target,pred=None,nmax=64,titre=None):
    '''display the 64 first images of the DB'''
    # set up the figure
    fig = plt.figure(figsize=(12, 12))  # figure size
    if titre is not None: plt.title(titre)
    fig.subplots_adjust(left=0, right=1, bottom=0, top=1, hspace=0.05, wspace=0.05)
    # plot the digits: each image is 8x8 pixels
    for i in range(nmax):
        ax = fig.add_subplot(8, 8, i + 1, xticks=[], yticks=[])
        image = data[i].reshape(8,8)
        ax.imshow(image, cmap=plt.cm.binary, interpolation='nearest')
        # label the image with the target value
        ax.text(0, 7, str(target[i]),color='b')
        # and the predicted value
        if pred is not None: ax.text(7,7, str(pred[i]),color='r')
plot_data(digits.data,digits.target,titre="data set initial")
1.3. Creation of the datasets for the learning phase#
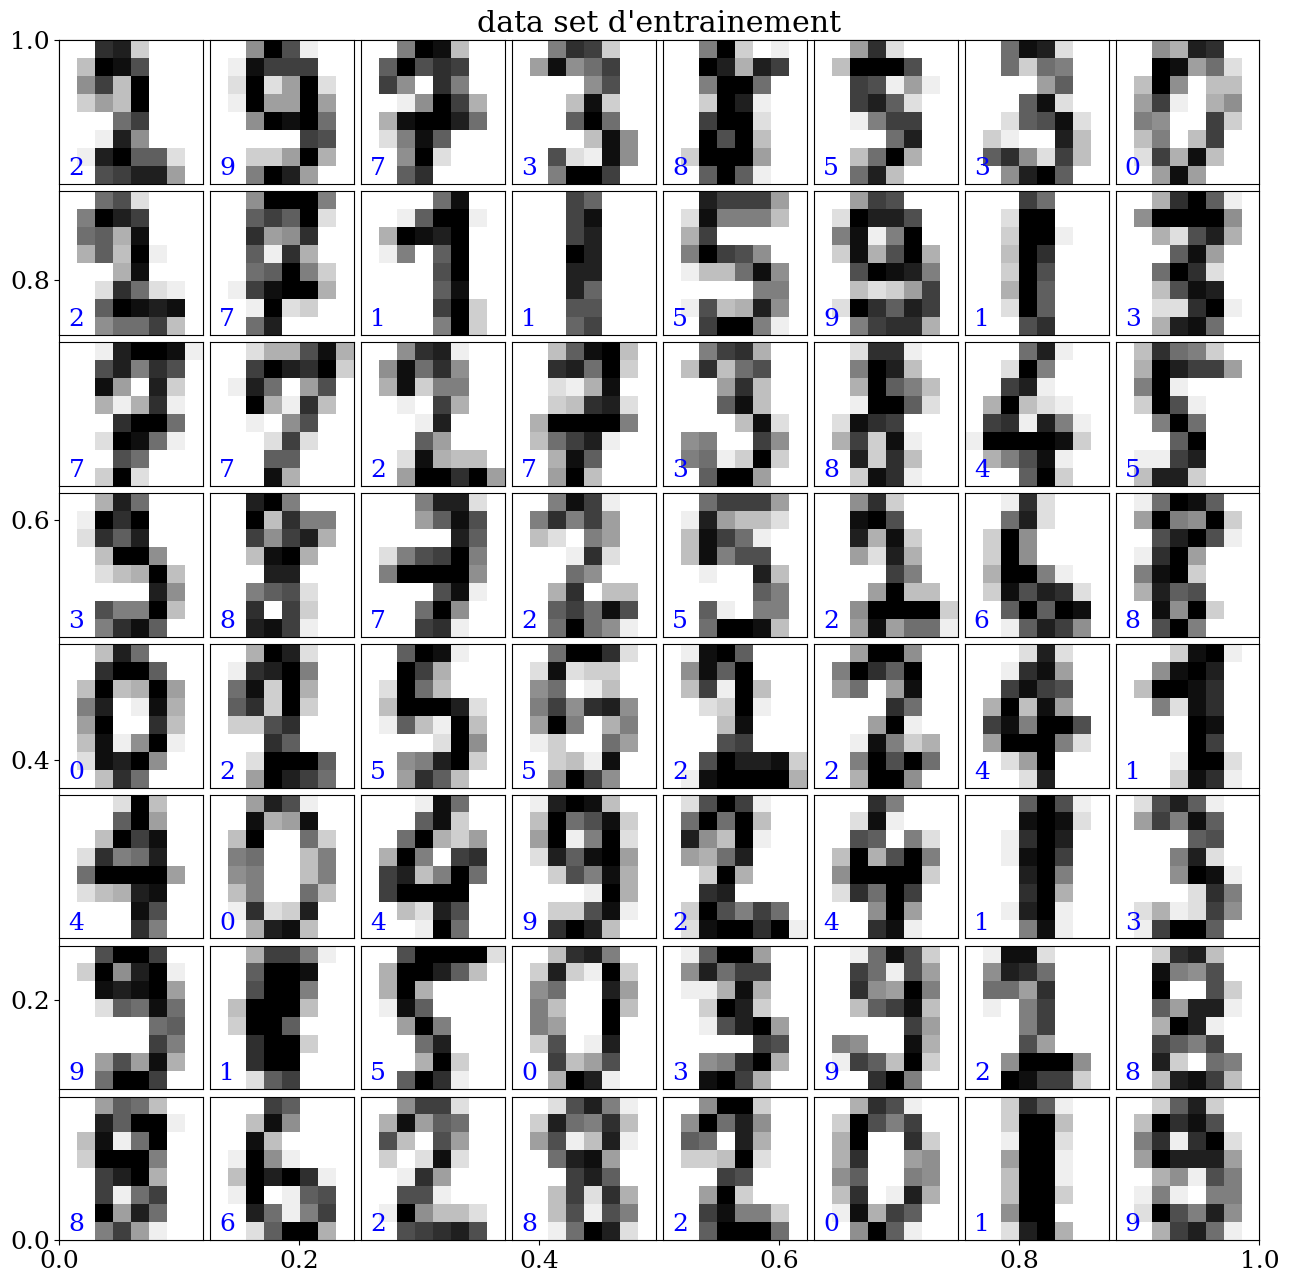
data set for the learning phase (learn)
data set for the validation phase (test)
split of the database in two sets: 80% for the training set and 20% for the test set using arbitrary split (depending of the student id)
from sklearn.model_selection import train_test_split

res = train_test_split(digits.data, digits.target,
                       train_size=0.8,
                       test_size=0.2,
                       random_state=NUMERO_ETUDIANT)
train_data, test_data, train_labels, test_labels = res
print("dataset training:",train_data.shape)
print("dataset test    :",test_data.shape)
dataset training: (1437, 64)
dataset test    : (360, 64)
plot_data(train_data, train_labels,titre="data set d'entrainement")
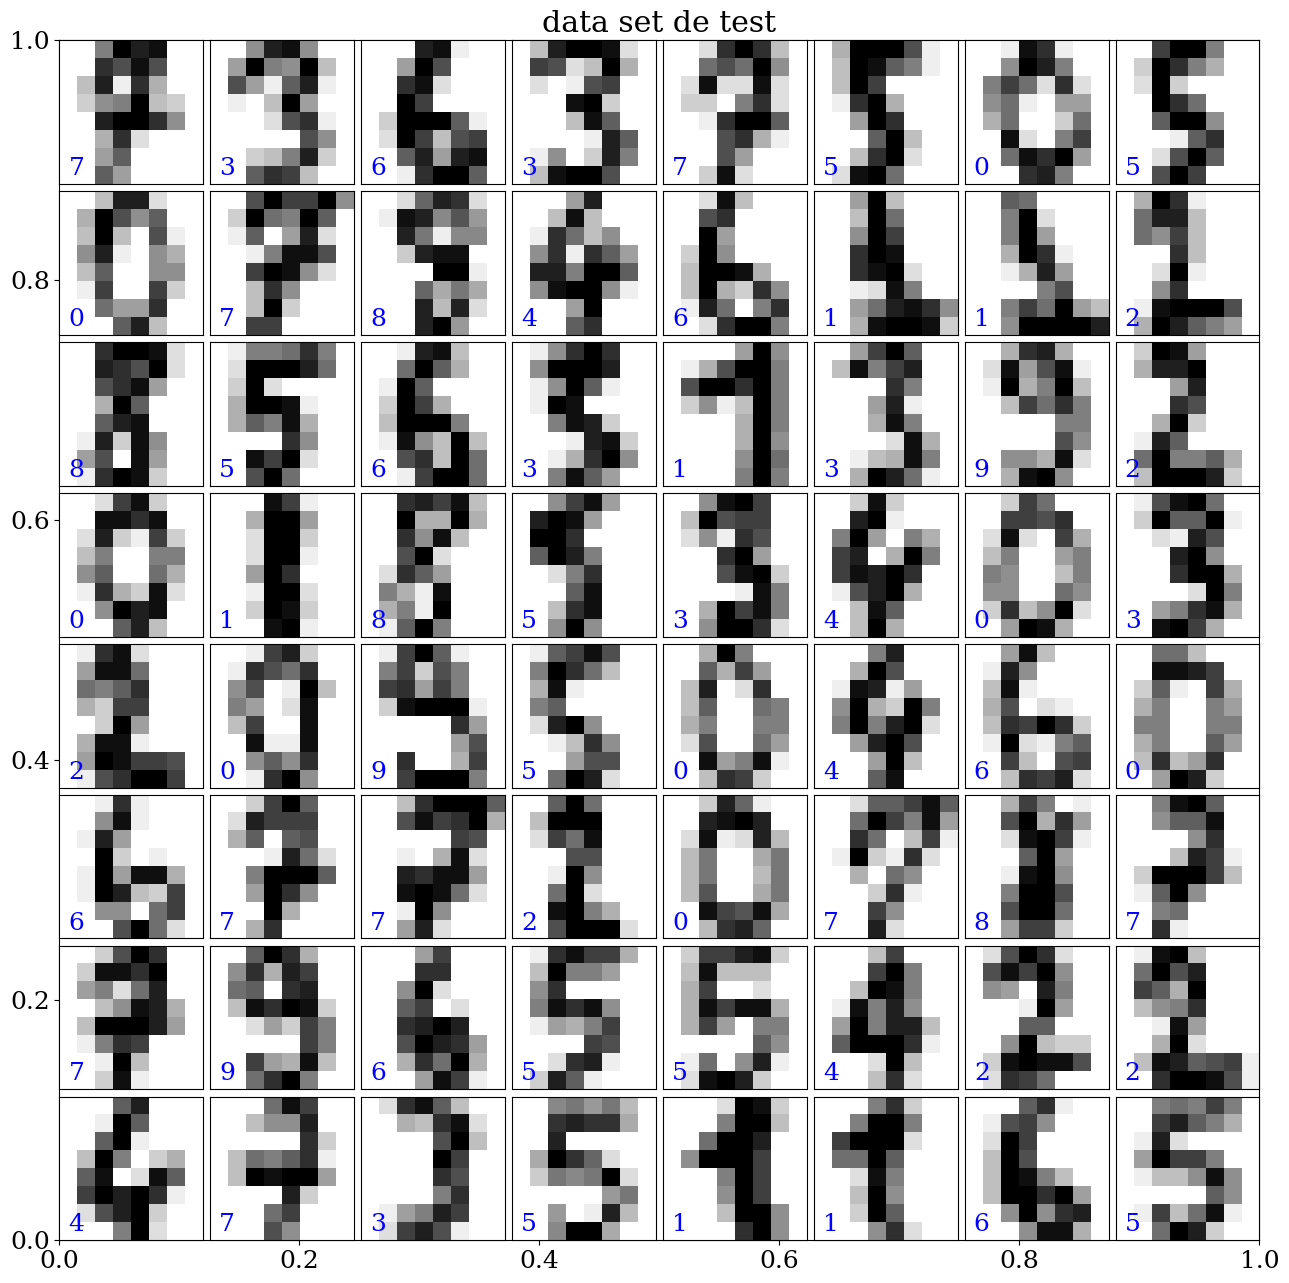
plot_data(test_data, test_labels,titre="data set de test")
1.3.1. definition of the data#
we need to use normalized data as a numpy array
X_train, y_train
X_test, y_test
beware of aliasing (explicit use of the copy function)
# normalization of the data
X_train = None
y_train = None
X_test  = None
y_test  = None
### BEGIN SOLUTION
X_train = train_data/15.0
y_train = train_labels.copy()
X_test  = test_data/15.0
y_test  = test_labels.copy()
### END SOLUTION
assert (X_train.shape == train_data.shape)
assert (y_train.shape == train_labels.shape)
assert (X_test.shape == test_data.shape)
assert (y_test.shape == test_labels.shape)
1.4. Linear model using a linear logistic regression#
Build of the linear model
scikit learn linear_model
model : LogisticRegression
Logistic regression, despite its name, is a linear model used for classification rather than regression. In the literature, logistic regression is also known as “logit regression,” “maximum entropy classification” (MaxEnt), or “log-linear classifier.” In this model, the probabilities that describe the possible outcomes of a single trial are modeled using a logistic function.
Logistic regression is implemented in LogisticRegression. This implementation can handle binary logistic regression, One-vs-Rest, or multinomial logistic regression, with optional regularization (l1, l2, elastic net, or none).
1.4.1. Logistic Regression#
Logistic regression is a statistical method for predicting binary classes. The outcome or target variable is dichotomous in nature, meaning there are only two possible classes. It calculates the probability of an event occurring.
This is a specific case of linear regression where the target variable is categorical. It uses a log of the odds as the dependent variable. Logistic regression predicts the probability of a binary event occurring using a logit function.
Equation of a linear regression
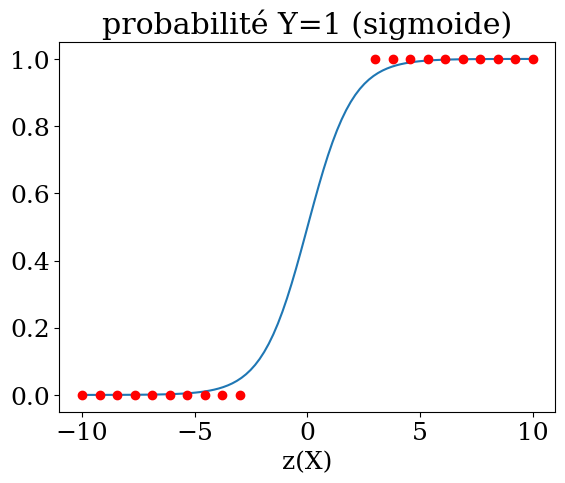
Sigmoid Function $\( p = \frac{1}{1+e^{-z}} \)$
Probability for y=1 $\( p = \frac{1}{1+e^{-(\beta_0 + \beta_1 X_1 + ... + \beta_n X_n)}}\)$
Y = np.linspace(-10,10,100)
plt.title("probabilité Y=1 (sigmoide)")
plt.plot(Y,1./(1+np.exp(-Y)))
Y1 = np.linspace(-10,-3,10)
plt.plot(Y1,np.zeros(10),'or')
plt.plot(-Y1,np.ones(10),'or')
plt.xlabel('z(X)');
Note: Regularization is applied by default, which is common in machine learning but not in traditional statistics. Another advantage of regularization is that it improves numerical stability.
To do: modify the parameters using the documentation.
parameters
max_iter (from 100 to 200)
normalization of the data
regularization
To do in the two following cells
Learning of the model with display of the score
Model testing and analysis of the prediction quality(criteria: accuracy_score, r2_score)
calculation of y_pred and accuracy (prediction rate)
import sklearn.linear_model

model=None
### BEGIN SOLUTION
model = sklearn.linear_model.LogisticRegression(penalty='l2',max_iter=200)
model = model.fit(X_train,y_train)
### END SOLUTION
assert(model.score(X_train,y_train))
print("score=",model.score(X_train,y_train))
score= 0.9846903270702854
from sklearn.metrics import accuracy_score,r2_score

y_pred = None
accuracy = None
### BEGIN SOLUTION
y_pred=model.predict(X_test)
print("predictions:\n",y_pred)
accuracy=accuracy_score(y_pred,y_test)
print("taux de prediction {:3d}%".format(int(accuracy*100)))
print("R2 score  {:.2f}".format(r2_score(y_test, y_pred)))
### END SOLUTION
predictions:
 [7 3 6 3 7 5 0 5 0 7 8 4 6 1 1 2 8 5 6 5 9 3 9 2 0 1 5 5 3 4 0 3 2 0 9 5 0
 4 6 0 6 7 7 2 0 7 8 7 7 9 6 5 5 4 2 2 4 7 3 5 1 1 6 5 6 1 0 9 1 5 1 9 0 6
 5 4 8 1 5 8 4 9 6 1 7 1 7 6 5 7 5 3 8 2 0 5 9 0 2 1 1 1 0 9 4 0 5 5 3 1 0
 6 8 6 5 2 7 6 1 6 8 0 3 8 3 6 5 3 8 2 3 6 9 6 8 2 3 1 9 3 9 5 5 9 8 1 4 7
 4 6 2 2 7 6 2 8 7 9 3 4 8 9 6 9 9 7 6 6 4 3 3 3 4 3 8 4 9 9 1 7 0 8 0 4 2
 8 6 8 9 8 5 8 9 8 3 4 7 1 7 2 3 1 7 7 6 2 0 7 3 2 0 5 0 6 0 6 3 6 5 3 4 8
 4 0 4 4 8 5 3 8 1 6 9 8 8 2 8 7 8 0 1 6 0 4 7 6 5 1 6 0 2 7 5 3 2 3 7 5 8
 1 8 4 7 2 2 1 8 1 9 0 2 0 3 0 3 2 5 9 8 4 3 6 1 7 0 5 6 8 3 3 5 4 9 4 1 6
 5 6 0 5 8 6 1 9 9 8 9 5 9 4 8 9 8 3 0 2 9 7 3 3 4 3 4 4 3 8 9 2 0 5 2 9 7
 0 5 6 6 0 6 3 5 2 9 6 5 5 1 0 4 2 7 2 3 1 5 5 8 5 7 1]
taux de prediction  97%
R2 score  0.92
assert(len(y_test) == len(y_pred))
assert(accuracy is not None)
1.4.2. Bonus#
Visualize the samples where the model is very wrong
Conclusion
# error test
## BEGIN SOLUTION
print("Erreur:\n",y_test==y_pred)
## END SOLUTION
Erreur:
[ True True True True True True True True True True True True
True True True True True True True False False True True True
True True False True True True True True True True True True
True True True True True True True True True True True True
True True True True True True True True True True True True
True True True True True True True True True True True True
True True True True True True True True True False True True
True True True True True True True True True True True True
True True True True False True True True True True True True
True True True True True True True True True True True True
True True True True True True True True True True True True
True True True True True True True True True True True True
True True True True True True True True True True True True
True True True True True False True True True True True True
True True True True True True True True True True True True
True True True True True True True True True True True True
True True True True True True True True True True True True
True True True True True True True True True True True True
True True True True True True True True True True True True
True True True True True True True True True True True True
True True True True True True True True True True True True
True True True True True True True True True True True True
True True True True True True True True True True True True
True True True True True False True True True True True True
True True True True True True True True True True True True]
1.5. Optional (test with a random forest model, SVM)#
1.5.1. Test using a Random Forest model#
To do: modify the parameters of RandomForestClassifier to improve the score.
It is possible to achieve at least 97% by simply adjusting the values of n_estimators and max_features. The documentation is available at this address:
to do in the two following cells
Learning of the model with display of the score
Model testing and analysis of the prediction quality(criteria: accuracy_score, r2_score)
calculation of y_pred and accuracy (prediction rate)
from sklearn.ensemble import RandomForestClassifier

model=None
### BEGIN SOLUTION
model = RandomForestClassifier(n_estimators=7,verbose=1,max_features=10)
model = model.fit(X_train,y_train)
### END SOLUTION
[Parallel(n_jobs=1)]: Using backend SequentialBackend with 1 concurrent workers.
[Parallel(n_jobs=1)]: Done   7 out of   7 | elapsed:    0.0s finished
assert(model.score(X_train,y_train))
print("score=",model.score(X_train,y_train))
score= 1.0
[Parallel(n_jobs=1)]: Using backend SequentialBackend with 1 concurrent workers.
[Parallel(n_jobs=1)]: Done   7 out of   7 | elapsed:    0.0s finished
[Parallel(n_jobs=1)]: Using backend SequentialBackend with 1 concurrent workers.
[Parallel(n_jobs=1)]: Done   7 out of   7 | elapsed:    0.0s finished
y_pred = None
accuracy = None
### BEGIN SOLUTION
y_pred=model.predict(X_test)
print("predictions:\n",y_pred)
accuracy=accuracy_score(y_pred,y_test)
print("taux de prediction {:3d}%".format(int(accuracy*100)))
print("R2 score  {:.2f}".format(r2_score(y_test, y_pred)))
### END SOLUTION
predictions:
 [7 3 6 3 7 5 0 5 0 7 8 4 6 1 1 2 8 5 6 3 1 3 9 2 0 1 8 5 3 4 0 3 2 0 9 5 0
 4 6 0 6 7 7 2 0 7 1 7 7 9 6 5 5 4 2 2 4 7 3 5 1 1 6 5 6 1 0 9 1 5 1 9 0 6
 5 4 8 1 5 8 4 1 6 1 7 1 7 6 5 7 5 3 3 2 0 5 9 0 2 1 1 1 0 9 4 0 5 5 3 1 0
 6 8 6 5 2 7 6 1 6 8 0 3 8 3 6 5 3 1 2 3 6 9 6 8 2 3 1 9 3 9 5 5 7 8 1 4 7
 9 6 2 2 7 6 2 8 7 9 3 4 7 9 5 9 9 7 6 6 4 3 3 3 4 3 8 4 9 9 1 7 0 8 0 4 2
 2 6 8 9 9 5 8 7 8 3 4 7 1 7 2 3 1 7 7 1 2 0 7 3 2 0 5 0 6 0 6 3 6 5 3 4 9
 4 0 4 4 8 5 3 8 1 6 9 8 8 2 8 7 8 0 1 6 0 4 7 6 5 1 6 0 2 7 5 3 2 1 7 5 8
 1 8 4 7 2 2 1 8 1 9 0 2 0 3 0 3 2 5 9 6 4 3 6 1 7 0 5 6 8 3 3 5 4 9 4 1 6
 5 6 0 5 8 6 1 9 9 8 9 5 9 4 8 9 8 3 0 2 7 7 3 3 4 3 4 4 3 8 7 2 0 5 2 9 7
 0 5 6 6 0 6 3 5 5 9 6 5 5 1 0 4 2 7 2 3 1 5 5 8 5 7 1]
taux de prediction  95%
R2 score  0.89
[Parallel(n_jobs=1)]: Using backend SequentialBackend with 1 concurrent workers.
[Parallel(n_jobs=1)]: Done   7 out of   7 | elapsed:    0.0s finished
assert(len(y_test) == len(y_pred))
assert(accuracy is not None)
1.5.2. Test using a Support Vector Machine model (SVM)#
To do: modify the parameters of svm.SVC to improve the score. It is possible to achieve at least 95%.
The documentation is available at this address:
to do in the two following cells
Learning of the model with display of the score
Model testing and analysis of the prediction quality(criteria: accuracy_score, r2_score)
calculation of y_pred and accuracy (prediction rate)
from sklearn import svm

model=None
### BEGIN SOLUTION
model = svm.SVC(C=1.0, kernel="rbf", degree=3)
model = model.fit(X_train,y_train)
### END SOLUTION
assert(model.score(X_train,y_train))
print("score=",model.score(X_train,y_train))
score= 0.9965205288796103
y_pred == None
accuracy = None
### BEGIN SOLUTION
y_pred=model.predict(X_test)
print("predictions:\n",y_pred)
accuracy=accuracy_score(y_pred,y_test)
print("taux de prediction {:3d}%".format(int(accuracy*100)))
print("R2 score  {:.2f}".format(r2_score(y_test, y_pred)))
### END SOLUTION
predictions:
 [7 3 6 3 7 5 0 5 0 7 8 4 6 1 1 2 8 5 6 5 1 3 9 2 0 1 8 5 3 4 0 3 2 0 9 5 0
 4 6 0 6 7 7 2 0 7 8 7 7 9 6 5 5 4 2 2 4 7 3 5 1 1 6 5 6 1 0 9 1 5 1 9 0 6
 5 4 8 1 5 8 4 1 6 1 7 1 7 6 5 7 5 3 8 2 0 5 9 0 2 1 1 1 0 9 4 0 5 5 3 1 0
 6 8 6 5 2 7 6 1 6 8 0 3 8 3 6 5 3 8 2 3 6 9 6 8 2 3 1 9 3 9 5 5 9 8 1 4 7
 4 6 2 2 7 6 2 8 7 9 3 4 7 9 6 9 9 7 6 6 4 3 3 3 4 3 8 4 9 9 1 7 0 8 0 4 2
 8 6 8 9 8 5 8 9 8 3 4 7 1 7 2 3 1 7 7 6 2 0 7 3 2 0 5 0 6 0 6 3 6 5 3 4 9
 4 0 4 4 8 5 3 8 1 6 9 8 8 2 8 7 8 0 1 6 0 4 7 6 5 1 6 0 2 7 5 3 2 3 7 5 8
 1 8 4 7 2 2 1 8 1 9 0 2 0 3 0 3 2 5 9 8 4 3 6 1 7 0 5 6 8 3 3 5 4 9 4 1 6
 5 6 0 5 8 6 1 9 9 8 9 5 9 4 8 9 8 3 0 2 9 7 3 3 4 3 4 4 3 8 9 2 0 5 2 9 7
 0 5 6 6 0 6 3 5 5 9 6 5 5 1 0 4 2 7 2 3 1 5 5 8 5 7 1]
taux de prediction  98%
R2 score  0.97
assert(len(y_test) == len(y_pred))
assert(accuracy is not None)
1.5.3. Analysis and conclusion#
In the following cell, write your analysis and conclusion using Markdown syntax.
On constate que dans ce cas l’algorithme SVM donne le meilleur résultat avec un taux de prédiction de 99%
