4. Exemple Jupyter AI avec mistral#
%load_ext jupyter_ai_magics
%config AiMagics.default_language_model = "mistralai:mistral-large-latest"

%env MISTRAL_API_KEY=xxxxxxxxxxxxxx
%%ai -f math
Generate the 2D heat equation in LaTeX surrounded by `$$`
\(\displaystyle \frac{\partial u}{\partial t} = \alpha \left( \frac{\partial^2 u}{\partial x^2} + \frac{\partial^2 u}{\partial y^2} \right) \)
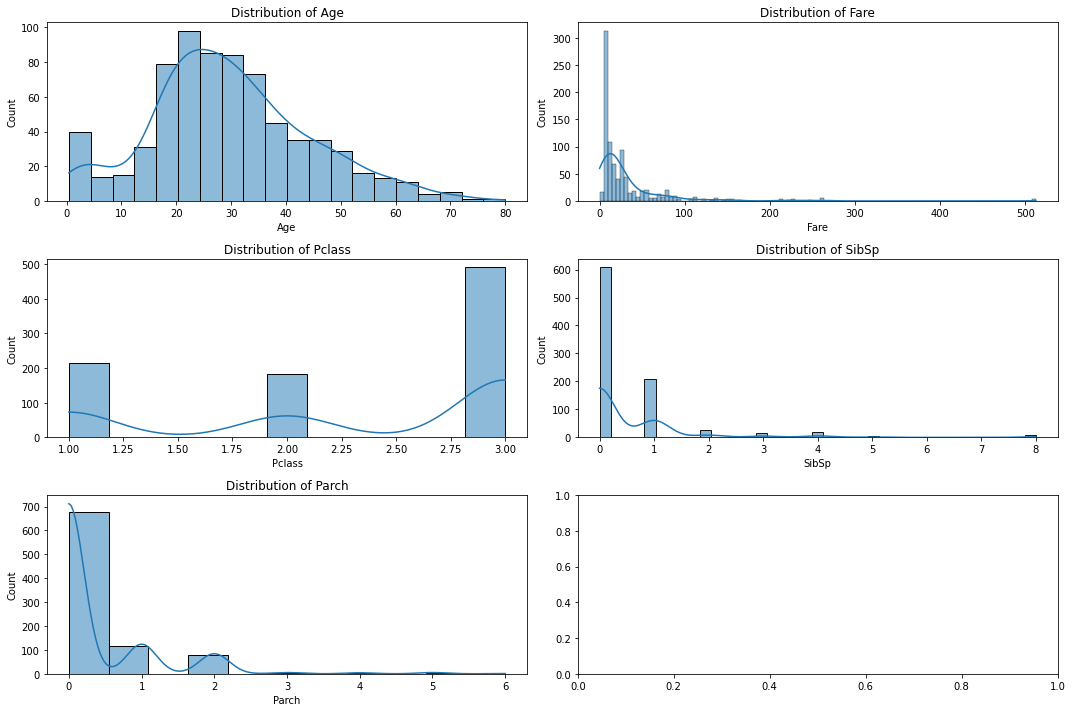
%%ai -f code
Load the "titanic.csv" file. Do a univariate analysis.
Write code to show the relevent plots.
Use a single figure to make te plots using subplots.
AI generated code inserted below ⬇️
import pandas as pd
import matplotlib.pyplot as plt
import seaborn as sns

# Load the dataset
titanic = pd.read_csv('titanic.csv')

# Select relevant columns for univariate analysis
columns = ['Age', 'Fare', 'Pclass', 'SibSp', 'Parch']

# Create a figure with subplots
fig, axes = plt.subplots(nrows=3, ncols=2, figsize=(15, 10))
axes = axes.flatten()

# Plot each column
for i, col in enumerate(columns):
    sns.histplot(titanic[col], kde=True, ax=axes[i])
    axes[i].set_title(f'Distribution of {col}')

# Adjust layout
plt.tight_layout()
plt.show()
4.1. The END#
%ai list
Provider |
Environment variable |
Set? |
Models |
|---|---|---|---|
|
|
❌ |
|
|
Not applicable. |
N/A |
|
|
|
❌ |
See https://huggingface.co/models for a list of models. Pass a model’s repository ID as the model ID; for example, |
|
|
✅ |
|
|
Not applicable. |
N/A |
See https://www.ollama.com/library for a list of models. Pass a model’s name; for example, |
|
|
❌ |
|
|
|
❌ |
|
Aliases and custom commands:
Name |
Target |
|---|---|
|
|
|
|
|
|
|
|
|
|
|
|
|
|
|
|