Etude de la courbe y=f(x)
| > | f:=x->x^4;x1:=-1;x2:=1; |
![]()
![]()
![]()
Tracé
| > | plot(f(x),x=x1..x2,thickness=3); |
![[Plot]](images/trajectoire_4.gif)
Trajectoire dans le plan
On se propose d'étudier la trajectoire d'un point P (x(t),y(t)) se déplacant sur une courbe y=f(x)
Initialisation
| > | restart:with(plots): with(plottools): with(linalg): |
Warning, the name changecoords has been redefined
Warning, the name arrow has been redefined
Warning, the protected names norm and trace have been redefined and unprotected
Etude de la courbe y=f(x)
| > | f:=x->x^4;x1:=-1;x2:=1; |
![]()
![]()
![]()
Tracé
| > | plot(f(x),x=x1..x2,thickness=3); |
![[Plot]](images/trajectoire_4.gif)
Dérivée: tangente
| > | diff(f(x),x); |
![]()
| > | df:=x->diff(f(x),x); |

| > | df:=unapply(diff(f(x),x),x); |
![]()
| > | df:=D(f); |
![]()
Tracé
| > | plot(df(x),x=x1..x2,thickness=3); |
![[Plot]](images/trajectoire_9.gif)
Longueur: calcul de la longueur de la courbe
| > | dl:=sqrt(1+df(x)^2); |
![]()
| > | Int(dl,x=x1..x2)=int(dl,x=x1..x2);evalf(rhs(%)); |
![Int((1+16*x^6)^(1/2), x = (-1 .. 1)) = -1/12*2^(1/3)*(-12*Pi^(1/2)*2^(2/3)*hypergeom([(-2)/3, (-1)/2], [1/3], (-1)/16)-2*Pi^2*3^(1/2)/(GAMMA(5/6)*GAMMA(2/3)))/Pi^(1/2)](images/trajectoire_11.gif)
![]()
Outils d'analyse avec Maple
| > | with(Student[Calculus1]): |
| > | CurveAnalysisTutor(f(x),x=x1..x2); |
| > | ArcLengthTutor(f(x),x=x1..x2); |
Trajectoires d'un point se déplaçant à vitesse uniforme suivant x
| > | X:=t->t; Y:=unapply(f(X(t)),t); t1:=0; t2:=fsolve(X(t)=x2,t=0..10); |
![]()
![]()
![]()
![]()
Tracé
| > | plot([X(t),Y(t),t=t1..t2],thickness=2,scaling=CONSTRAINED); |
![[Plot]](images/trajectoire_17.gif)
Calcul de la Vitesse en différents points de la trajectoire
| > | DX:=D(X); DY:=D(Y);U:=[DX(t),DY(t)]; |
![]()
![]()
![]()
| > | N:=10; dt:=(t2-t1)/(N-1); Tp:=vector([seq(evalf(i*dt),i=0..N-1)]); |
![]()
![]()
![]()
| > | Mx:=vector([seq(evalf(X(Tp[i])),i=1..N)]);My:=vector([seq(evalf(Y(Tp[i])),i=1..N)]); |
![]()
![]()
| > | Ux:=vector([seq(evalf(DX(Tp[i])),i=1..N)]);Uy:=vector([seq(evalf(DY(Tp[i])),i=1..N)]); |
![]()
![]()
Tracé de la vitesse
| > | P1:=plots[arrow]({seq([[Mx[i],My[i]],[Ux[i],Uy[i]]],i=1..N)},shape=arrow,color=red,thickness=3,length=[0.05,relative]):P2:=plot([X(t),Y(t),t=t1..t2],thickness=1,color=blue):
display({P2,P1}); |
![[Plot]](images/trajectoire_28.gif)
Abscisse curviligne
| > | ds:=unapply(simplify(sqrt(DX(t)^2+DY(t)^2)),t);
Int('ds'(t),t)=int(ds(t),t); |
![]()
![Int(ds(t), t) = t*hypergeom([(-1)/2, 1/6], [7/6], -16*t^6)](images/trajectoire_30.gif)
| > | s:=unapply(int(ds(tau),tau=0..t),t); evalf(s(1)); |
![s := proc (t) options operator, arrow; -1/24*2^(1/3)*(-12*Pi^(1/2)*t^4*2^(2/3)*hypergeom([(-2)/3, (-1)/2], [1/3], -1/16*1/t^6)-2*Pi^2*3^(1/2)/(GAMMA(5/6)*GAMMA(2/3)))/Pi^(1/2) end proc](images/trajectoire_31.gif)
![]()
| > | plot(evalf(s(t)),t=t1..t2,title="longueur de la trajectoire",thickness=2); |
![[Plot]](images/trajectoire_33.gif)
Repere de Frenet: vecteur T tangent et N normal
| > | T:=evalm(1/ds(t)*U); dT:=factor([diff(T[1],t),diff(T[2],t)]);
dTds:=factor(sqrt(dT[1]^2+dT[2]^2)); N:=(evalm(1/dTds*[dT[1],dT[2]])); |
![T := vector([1/(1+16*t^6)^(1/2), 4*t^3/(1+16*t^6)^(1/2)])](images/trajectoire_34.gif)
![dT := [-48*t^5/(1+16*t^6)^(3/2), 12*t^2/(1+16*t^6)^(3/2)]](images/trajectoire_35.gif)

![N := vector([-4*t^5/((t^4/(1+16*t^6)^2)^(1/2)*(1+16*t^6)^(3/2)), t^2/((t^4/(1+16*t^6)^2)^(1/2)*(1+16*t^6)^(3/2))])](images/trajectoire_37.gif)
Acceleration et accelération normale
| > | D2X:=D(DX); D2Y:=D(DY); GM:=factor(D2X(t)*N[1]+D2Y(t)*N[2]); |
![]()
![]()
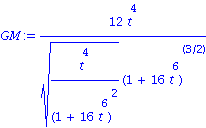
Carre de la vitesse et courbure
| > | V2:=DX(t)^2+DY(t)^2; |
![]()
| > | R:=V2/GM; |
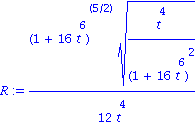
Tracé de la courbure
| > | plot(1/R,t=t1..t2,discont=true,thickness=2); |
![[Plot]](images/trajectoire_43.gif)
Calcul en fonction de la dérivée seconde
| > | C:=diff(f(x),x$2)/(1+diff(f(x),x)^2)^(3/2);
plot(C,x=0..x2,thickness=2); |

![[Plot]](images/trajectoire_45.gif)
Repere de Frenet en un point
| > | t0:=0.5; M0:=[X(t0),Y(t0)]; U0:=[DX(t0),DY(t0)];G0:=[D2X(t0),D2Y(t0)];
R0:=evalf(subs(t=t0,R)); T0:=evalf(subs(t=t0,evalm(T)));N0:=evalf(subs(t=t0,evalm(N))); |
![]()
![]()
![]()
![]()
![]()
![]()
![]()
Tracé du repere de Frenet
| > | P1:=plots[arrow]({[M0,N0],[M0,T0]},shape=arrow,color=pink,thickness=3,length=[0.5,relative],
scaling=CONSTRAINED): P11:=plots[arrow]({[M0,U0],[M0,G0]},shape=arrow,color=red,thickness=2,length=[0.1,relative], scaling=CONSTRAINED): C0:=evalf(evalm(M0+R0*N0)): C:=circle([C0[1],C0[2]],R0,color=green):MC:=point([C0[1],C0[2]],color=black,thickness=5): P2:=plot([X(t),Y(t),t=t0-0.5..t0+0.5],color=blue): display({P1,P11,C,MC,P2}); |
![[Plot]](images/trajectoire_53.gif)
Relation entre courbure et dérivée
| > | DS:=sqrt(1+DF(x)^2);TX:=1/DS; TY:=DF(x)/DS; |
![]()


| > | DTX:=diff(TX,x)/DS;
DTY:=simplify(diff(TY,x)/DS); |
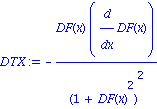
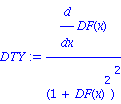
| > | sqrt(simplify(DTX^2+DTY^2)); |

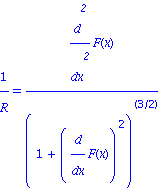
| > | R:='R': 1/R=diff(F(x),x$2)/(1+diff(F(x),x)^2)^(3/2); |
FIN!