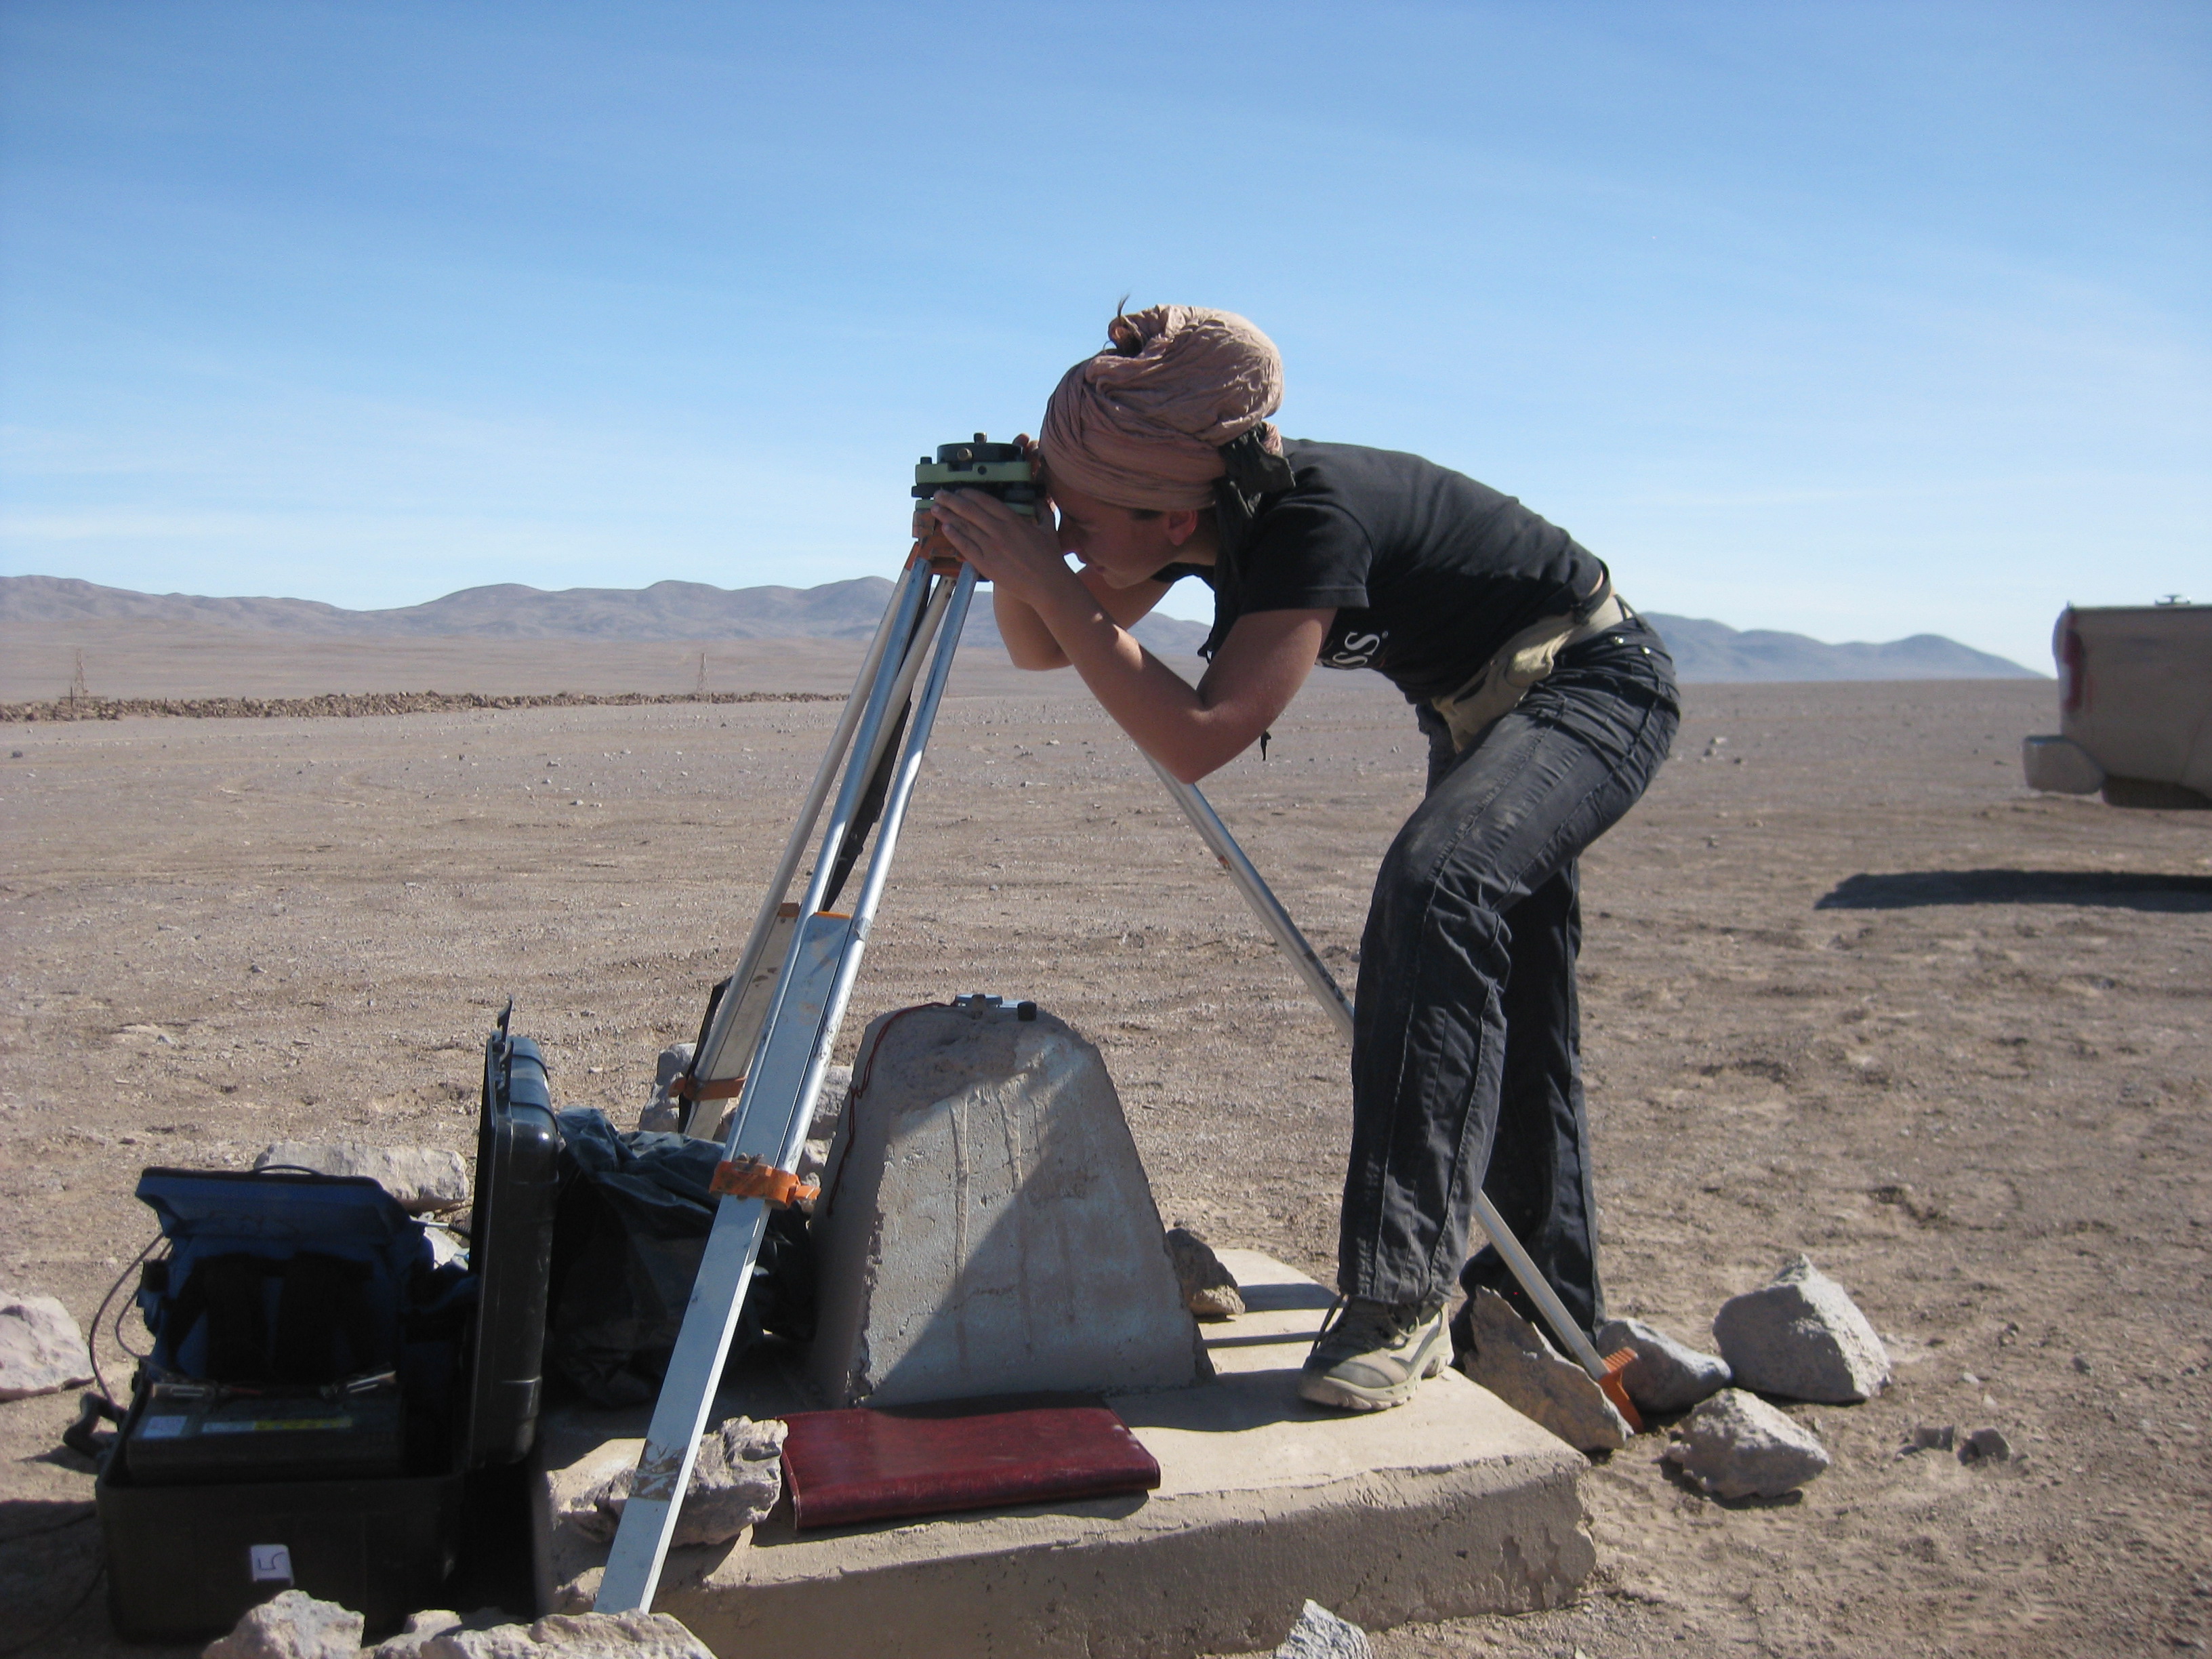
Andean field-work -- Terrain Andin -- De vuelta en los Andes
|
We were on the fied in Chile/Argentina just before lock-down... with colleagues from IPGP,IPGS and ENS Paris. This was a high altitude (can you see the GNSS antenna on the picture ?), exhausting but great mission aiming at better quantifying the Andean straining at the Copiapo latitude (~28S).
|
Albanian field-work -- Terrain en Albanie -- Fushë në Shqipëri
|
The campaign GPS network first installed by F.Jouanne in 2003 was remeasured on June 2017 with Albanian and U.Savoie colleagues. More than 30 benchmarks, including 7 newly installed ones were measured. We hope to better constrain the kinematics and dynamics of the Alps to Hellenic subduction zone transition. Findings coming soon !
|
Amatrice earthquake -- Terremotto di Amatrice -- Séisme d'Amatrice
|
A strong Mw 6.2 earthquake stroke central Italy on 24 of August of 2016, near Amatrice, few tens of kilometers South of Perugia causing hundred of casualties and huge destructions. GPS data acquired before the earthquake coming mainly from the RING network maintained by INGV and other non-academic networks (interseismic velocities shown in Fig.C) had shown that this area was highly straining before the earthquake (redish area in Fig.A and C) like the main part of the Apennines' crest extending in a chain perpendicular direction (principal strain direction shown in Fig.C).
The Italian Peninsula results from the closure of the Tethyan ocean due to the still on-going collision between Nubia (Africa) and Eurasia. Inbetween both plates, several microplates collided, in particular the Adria and Apulian microplates that form the Adriatic promontory, and the Tyrrhenian bloc to the West of Italy. The current extension of the Apennines mountain belt, taken by several normal fault systems is risponsible for the intense seismic activity in Central Italy, including the Amatrice and L'Aquila (2009) events. For more detailed information, please refer to INGV website and INSU website for french readers. Figure Caption : A- Map of the second invariant of the strain rate tensor derived from GPS interseismic velocities (see [Métois et al. 2015]) on the Italian peninsula and surroundings. It gives an idea of the amplitude of the strain rate in the area, that is maximal on the Apennines' crest and on the Eastern Alps front. Grey beachballs are from the RCMT catalog since 1977, the red focal mechanism is the Amatrice mechanism from INGV. B- Zoom on the epicentral area. The grey dots are the Amatrice related aftershocks scaled by magnitude, the foreshock mechanism is plotted in red. The rough traces of normal faults of the area are plotted in grey from the SHARE catalog. GPS velocities prior to the earthquake are plotted relative to stable Eurasia (white arrows). The principal strain directions are plotted using green (extension) or black (compression) rectangles. The dashed line is the profile plotted in figure C. C- Topographic (Top) profile and horizontal velocity projected along the profile line for the dashed line plotted in Fig.B. A ~5mm/yr gradient is clearly visible across the Apennines. |
Rotating Balkans -- Rotazione Balkanica
| At INGV Rome, we processed tens of GPS data coming from non-academic GPS networks in the Balkan Peninsula. These new interseismic velocities show an overall escape motion of the inner Balkans toward the Aegean and a clear clockwise rotation pattern up central Serbia that we kinematically analyzed. This rotation or shearing pattern around the Scutari-Peck area seems persistent since Eocene and recall the sharp orientation changes in velocities observed in the Eastern Himalaya syntaxis.... at a completely different scale ! See our paper for more details. |
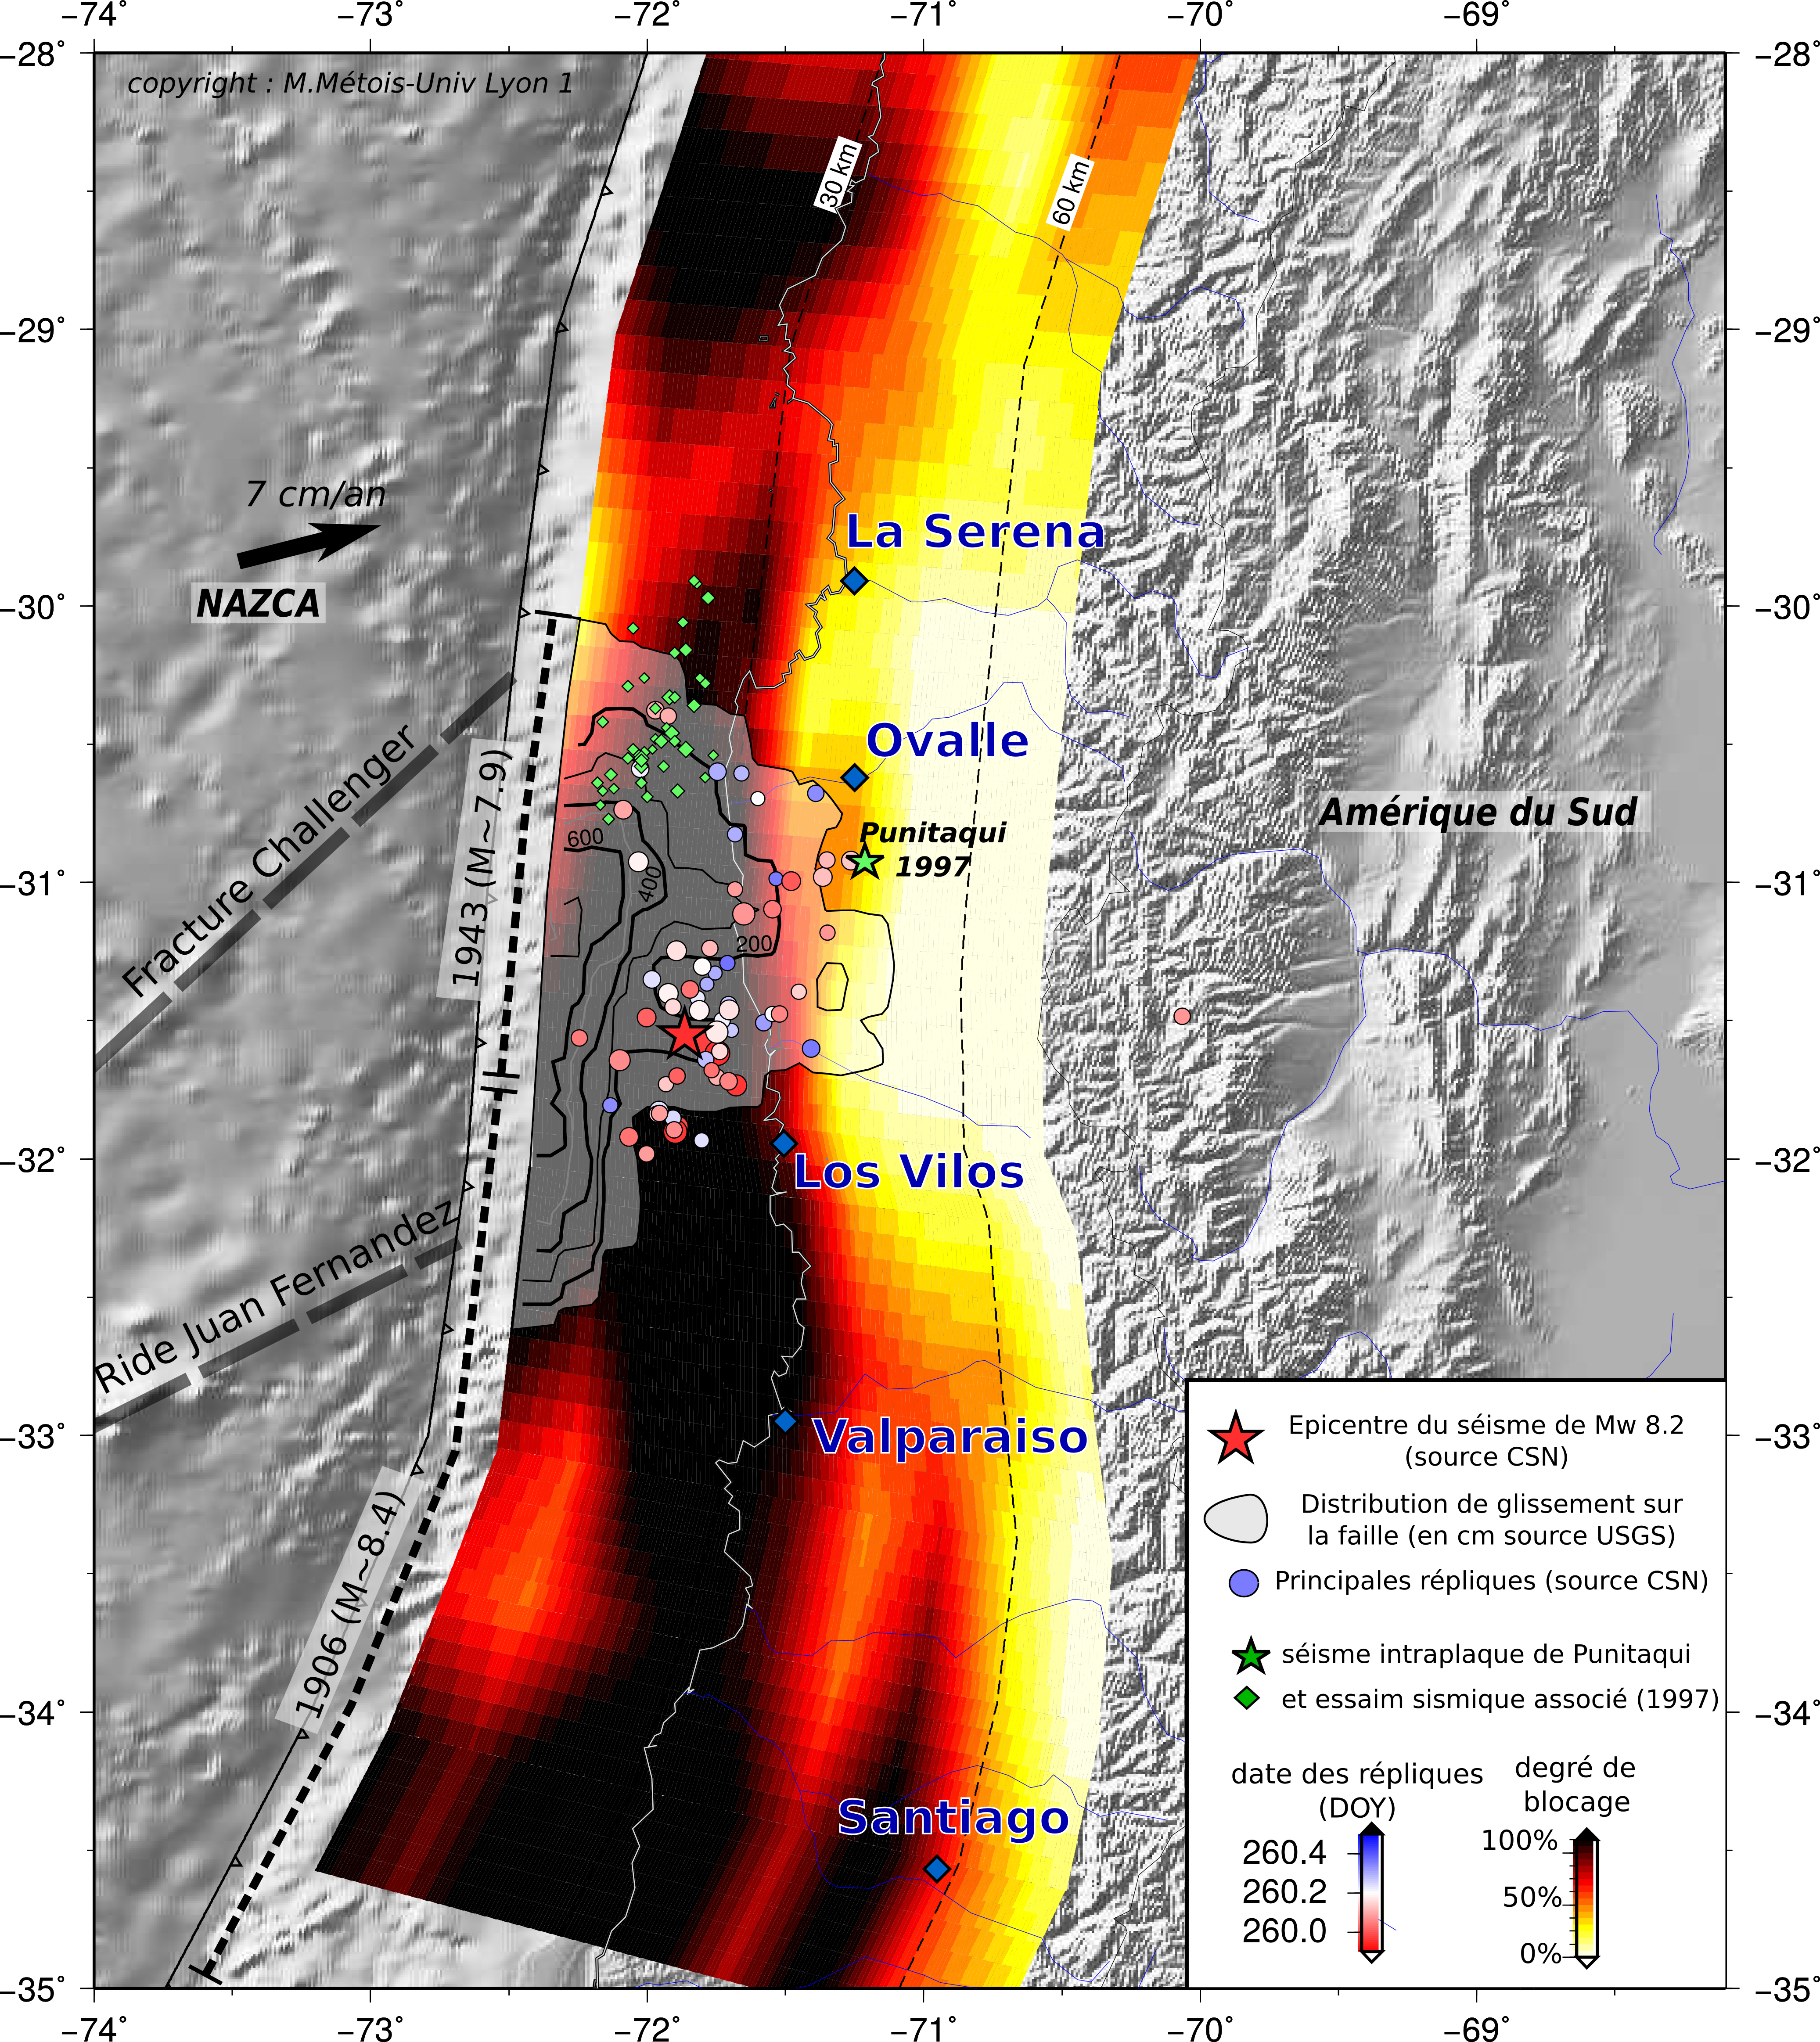
About Mw 8.2 Illapel quake -- Mw 8.2 Illapel-Canela terremoto
| At 7pm local time on the 16th of september 2015, the Mw 8.2 earthquake stroke Central Chile and was strongly felt down to Santiago. Look a the preliminary INSU note, for french readers! See also our paper in SRL. |
|
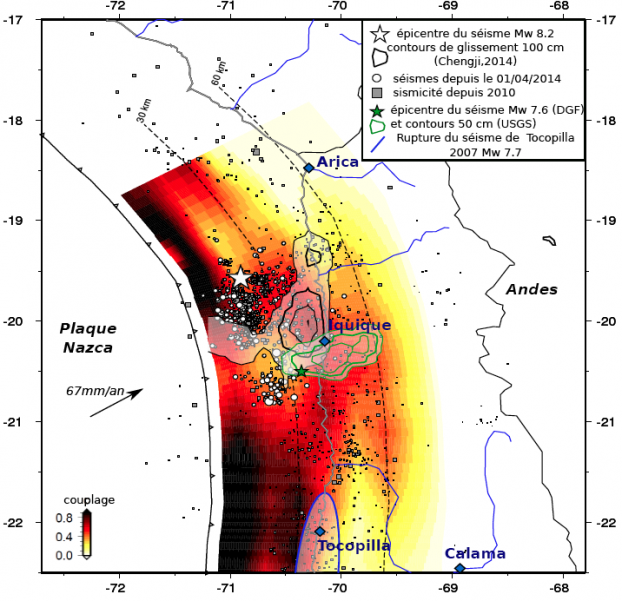
About Mw 8.2 Iquique quake -- Mw 8.2 Iquique terremoto
|
On April 1st 2014, a Mw 8.2 earthquake stroke North Chile, while we were looking at the unusual seismicity in the area. I was involved in a short note on the situation on the INSU website.
You can also have a look to the Nature news' story written by Alexandra Witze that gather IPOC-involved researchers opinions on it.
The Iquique earthquake has been preceeded by intense seismic activity and slow trenchward deformation of the crust captured by continuous GPS stations installed there. This swarm like activity, potentially accompanied by slow aseismic slip on the interface, occurred several times in the Iquique low-coupled segment since 2008 at least. We published our first conclusions on this precursory activity on Science (see here). For a short french-written summary, you can have a look to the INSU-CNRS note about this publication here. |
|
Deformation & seismic cycle -- Déformation et cycle sismique -- Deformación y cyclo sísmico
| Lithosphere deforms over the seismic cycle depending on the amplitude and timing of the slip occuring on the plate interface. Part of the deformation pattern can be captured by geodetic measurements (GNSS, Insar) during co-, post- and interseismic phases, helping in mapping current slip and/or coupling on the fault. |
I also took part to the postseismic fieldwork follwoing the 2010, Mw 8.8 Maule earthquake in Central Chile. We collected GPS data to observe the coseismic deformation pattern of the region and constrain the slip distribution (see also here).
I am particularly interested in understanding the link between kinematic coupling and the mechanical behavior of the subduction interface that seems to be composed of interfingerring of asperities either creeping or behaving in "stick-slip" mode.
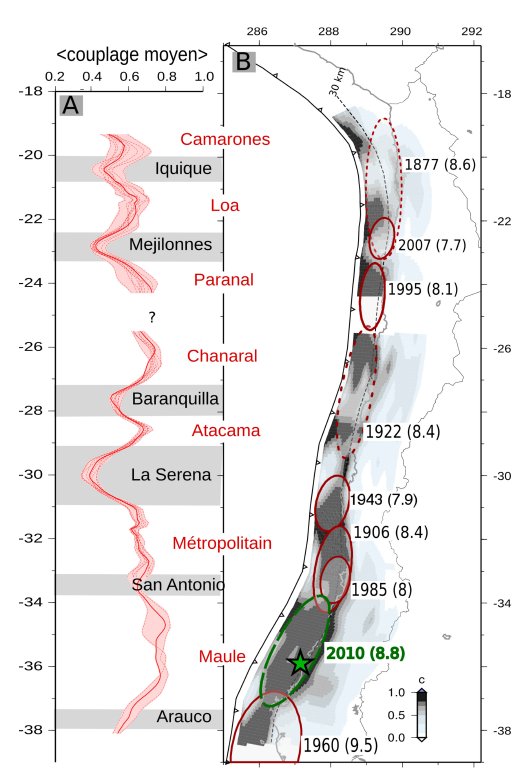
Chilean margin & segmentation -- Subduction & segmentation au Chili
At first order, segments correlate with rupture zones of historical or instrumental megathrust earthquakes while intersegments are correlated with parts of the subduction that behave as barriers to the seismic propagation and which experience high background seismicity.
Does a link exist between current interseismic coupling calculated over 20 yrs and the morphology and the permanent deformation seen in the topography and morphology of the Chilean margin ? I am currently working on that point.
Field work -- Travail de terrain -- Terreno
|
Field work is research ! During my PhD I spent 6 months in Chile to install and measure campaign networks and maintain permanent stations. We have installed more than 60 new benchmarks North of La Serena (30°S) since 2009, mainly using bedrock sealed benchmarks. More details about the networks can be found in Christophe webpage.
I processed these campaign measurements using the GAMIT/GLOBK software and reprocessed older data acquired in Chile since 1996 to get an homogeneous velocity field sampling the interseismic deformation. |

Lithosphere elastic thickness -- Epaisseur élastique de la lithosphère
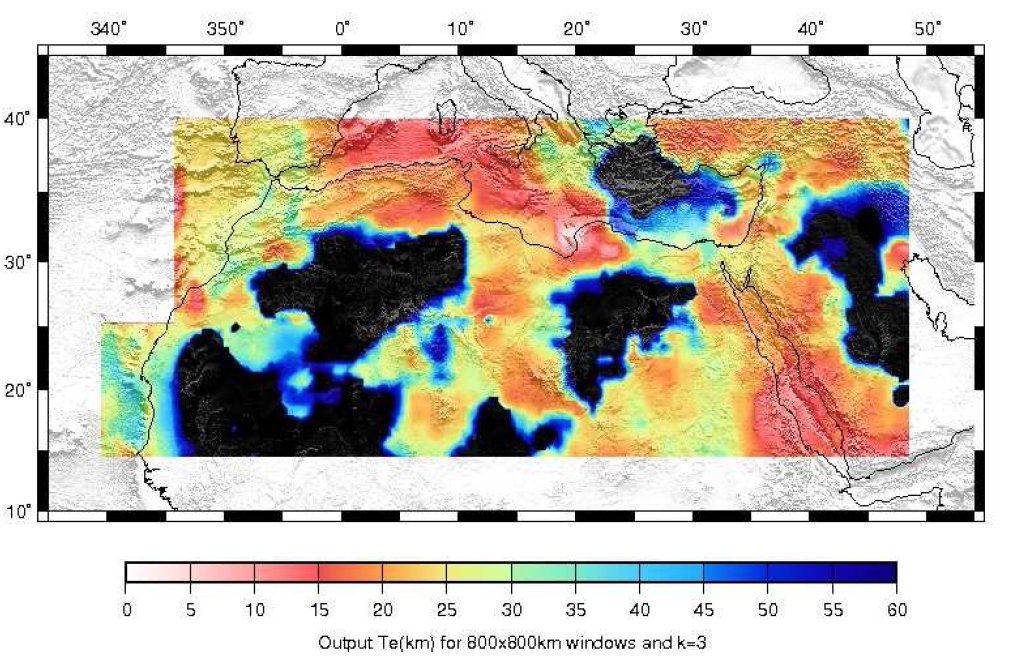
Part of this work has been published in EPSL (see here)