AC synchronous generator (alternator) driven by a Pelton turbine : synchronization to grid
Intro
This page contains a simulation (Fig. 1) of a Pelton-type hydraulic turbine, a synchronous generator (alternator) with separate excitation, synchronization devices (synchroscope, indicator lights, voltmeters) and coupling switches. It is possible to view the phasor diagram of the grid voltages, the generator voltages and the voltages across the switches. Once the generator is grid-tied, you can see the plotted phasor diagram of the generator.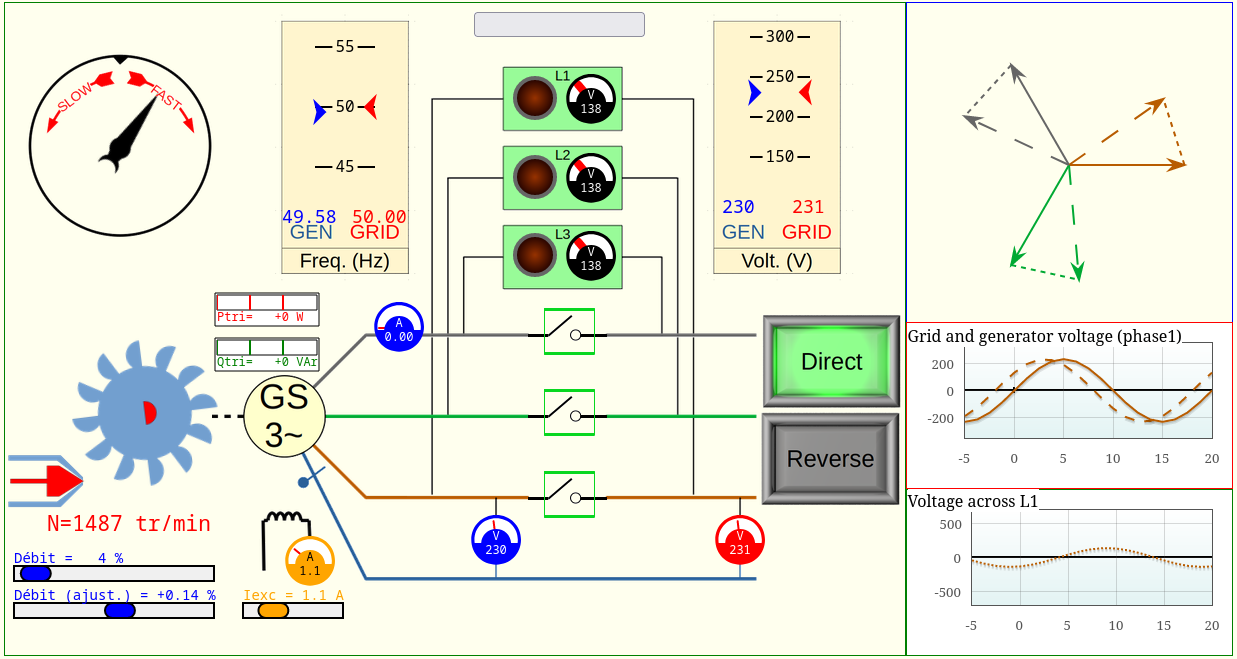
Turbine and generator
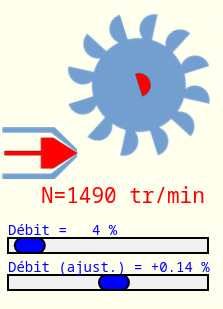
Water is admitted to a Pelton turbine by means of a nozzle, fitted inside with a movable needle valve (in red in Fig. 2 on the left), which allows the flow rate (and therefore the torque) to be adjusted. In the simulation, the adjustment is made with two blue sliders. The upper one allows a coarse adjustment, the second a finer adjustment making it easier to find the point of synchronism. The turbine is mechanically connected to a transmission which drives the generator. The speed N of the generator (in rotations per minute) is indicated in red.
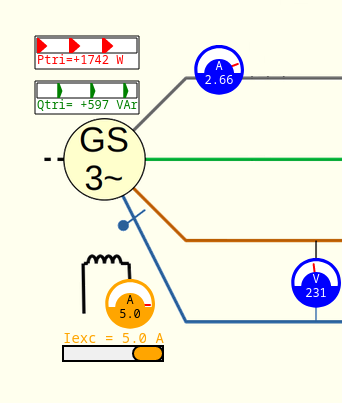
The three-phase synchronous generator - or alternator - (Fig. 2 right) is driven by the turbine. It has an excitation (field) circuit shown in orange. The slider is used to adjust the DC excitation current.
- When the generator is not coupled to the grid, the excitation current is used to regulate the voltage;
- when the generator is coupled to the grid, the excitation current is used to adjust the reactive power Qtri exchanged. For a low excitation current, the generator absorbs reactive power. For a high excitation current, the generator provides reactive power.
Tie circuit breaker and grid phase sequence
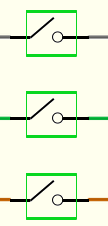
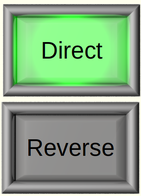
Figure 3 (left) shows the circuit breaker that allow the generator to be connected to the grid. A click on one of the three switches closes the three switches at the same time (if they are open) or opens them if they are closed. The closing of the switches can only be considered if one is close to the optimal conditions of synchroniation (see below).
When the simulation is launched, the phase sequence is the same for the generator and for the grid (direct). It is possible to change the phase sequence of the grid by clicking on the "Reverse" button (Fig. 3 right). You can of course return to the direct sequence by clicking on the "Direct" button.
Frequency and voltage indicators
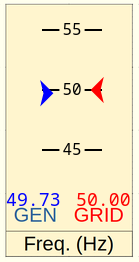
The measurements of the generator and grid frequencies are grouped on one device (Fig. 4 left) in order to be able to easily check one of the conditions of synchroniation, namely a small frequency difference between generator and grid. The blue color is used for the generator, and the red color for the grid. The numerical value of the frequencies is given, as well as a visual indication consisting of two triangular needles.
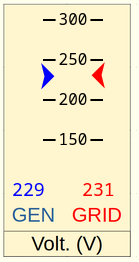
A similar indicator exists for phase-to-neutral voltages (Fig. 4 right). Here again, the two needles make it possible to visually ensure that the voltages of the generator and of the network are sufficiently close.
Synchroscope and lamps
Two measuring devices are used to determine the phase difference between the voltages of the generator and those of the grid:
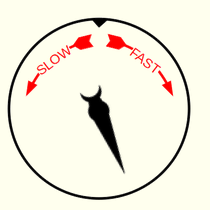
- the synchroscope (Fig. 5a);
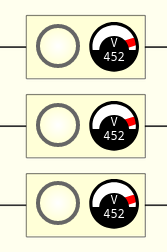
- the voltage indicators (lamps and voltmeters) at the terminals of the switches (Fig. 5b).
The synchronoscope pointer directly gives the phase difference between generator and grid. When this pointer is vertical and points upwards, the phase shift is zero. If the pointer is pointing down, the phase shift is 180°. When the pointer points rather to the right, the voltages of the generator are leading those of the grid. If the pointer points to the left, the grid is leading.
 (a)
(a)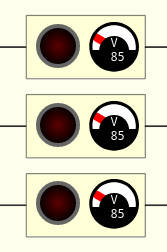 (b)
(b)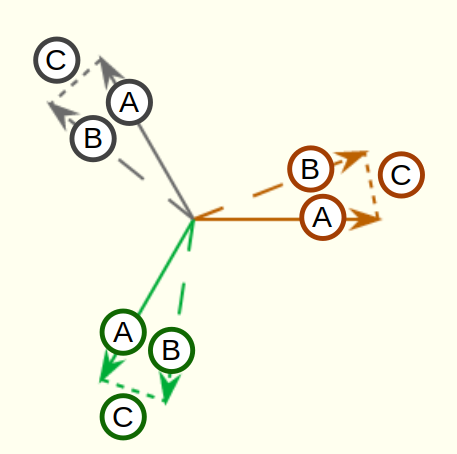 (c)
(c)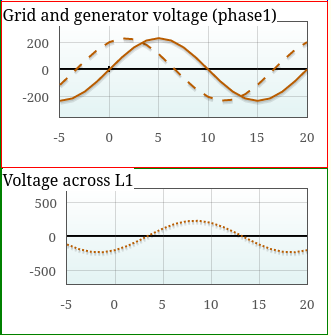 (d)
(d)
Conditions for synchronization
The conditions for synchronization of the generator to the grid under good conditions are:
- same phase sequence for generator and grid;
- same frequency (or at least a sufficiently small difference);
- same voltage (or at least a sufficiently small difference);
- a sufficiently small phase difference.
Synchronization with "dark lamp method"
In this paragraph, the description of the synchronization conditions relates to "dark lamp method". For "two bright and one dark lamp" method, see dedicated paragraph.Condition 4 can be checked with the instruments shown in Figure 5.
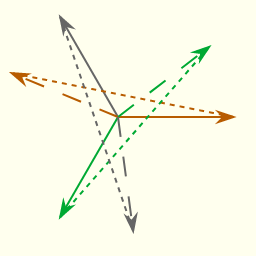
Provided that the voltage of the generator is equal (or at least close) to the voltage of the grid, it is possible to determine the moment when the phase difference between generator and grid is zero by measuring the voltages at the terminals of the breaker. Indeed, when the phase difference vanishes, the voltages at the terminals of the breaker (corresponding to the dotted lines Ⓒ in Fig. 5 right) also vanish. These voltages can be visualized in two ways in the simulation (Fig. 5b):
- with black voltmeters;
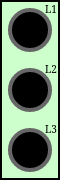
- with bulbs, represented by circles. When the voltage is low, the bulb is dark. When the voltage is high, the bulb glows (white).
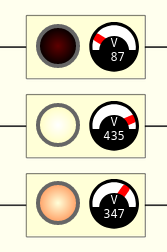
Conversely, figure 6b illustrates a moment when synchronization is impossible:
- the phase difference is close to 180° (synchroscope pointer close to the bottom);
- the voltage across the terminals of the breaker is high (close to twice the phase-to-neutral voltage of the network) and the indicator lights are lit.
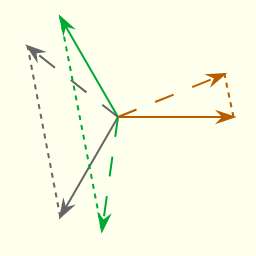
Finally, Fig. 6c represents a condition where synchronizing is impossible, because the phase sequences of the network and of the generator are not the same. In the simulation, this condition can be obtained by clicking on the "Reverse" button (Fig. 3).
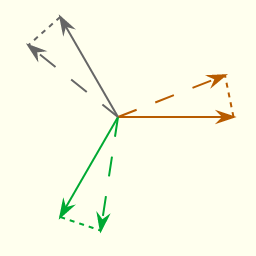
In this configuration, it is impossible to obtain the simultaneous cancellation of the three voltages across the terminals of the breaker. One can in fact observe by looking at the phasor diagram of the voltages that when a voltage across the terminals of a switch (dotted lines) decreases, at least one other voltage increases. The visual effect on the lamps is noticeable, when we place ourselves at a low but not zero frequency difference (for example around 0.5Hz):
- if the phase sequence are the same for the generator and the mains ("Direct" position), the lights come on and go off at the same time (flashing lights);
- if the phase sequence are different ("Reverse" position), the lights come on and go out one after the other (rotating lights).
Synchronization with "two bright and one dark lamp method"
 (a)
(a)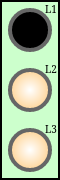 (b)
(b)- by the extinction of the lamp L1;
- by the same brightness of lamps L2 and L3.
It should be noted that the appearance of the lamps is reversed when passing from a connection "at extinction" to a connection "at ignition". It is therefore necessary to know the actual connection type of the installation. The table below summarizes the different scenarios.
Same phase sequence |
Opposite phase sequences |
|||
|---|---|---|---|---|
| Apparence of lamps before synchronization | Synchronization conditions | Apparence of lamps | Synchronization conditions | |
| Three dark method |  |
 |
 |
Synchronization IMPOSSIBLE |
| One dark three bright method | |
|
|
Synchronization IMPOSSIBLE |