ZMW benchmarks
CPU/#widgets
CPU/cache
Heap/#widgets
Stack/#widgets
Last modified: Mon Jul 5 14:51:32 CEST 2004
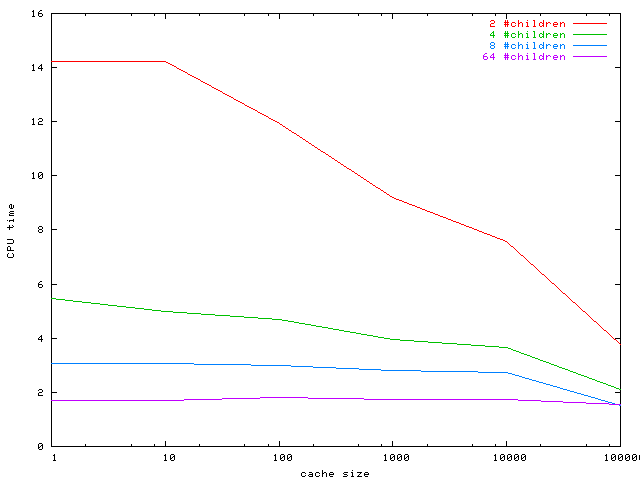
For 262144 widget leaves this graph give the CPU time to display
the widget tree in function of the widget geometry-cache size.
These is a curve for 2,4,8,64 children per node.
Beware, if there is 64 children per node the total
number of children is nearly divided by 2.
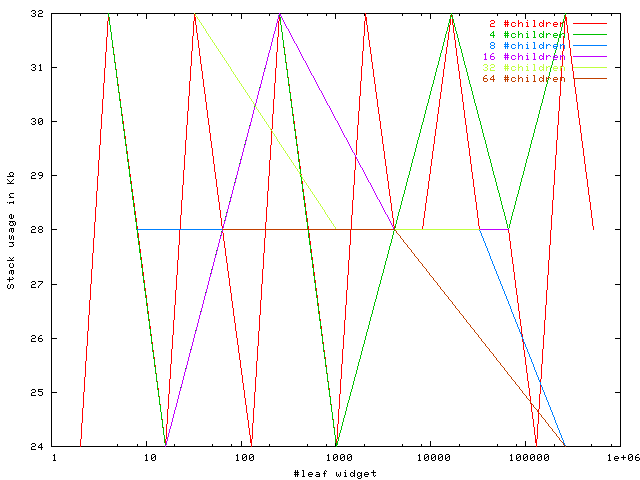
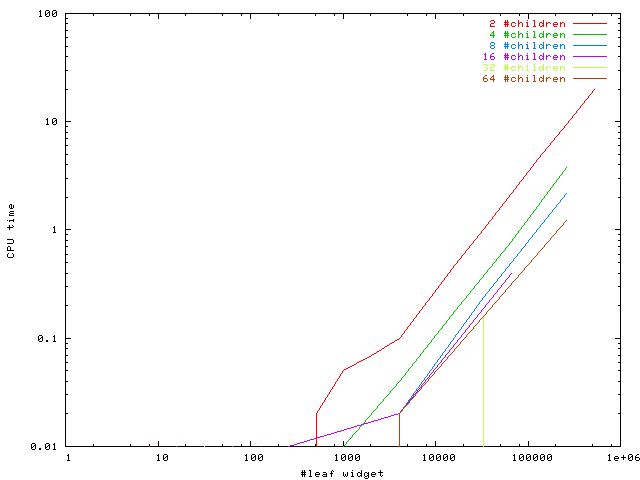
This graph give the CPU time to display in function
of the number of widgets.
The measure is done in 1/100 of seconds so the plot
is inacurate for small time.
If a geometry cache is used the plot is only translated down.
This graph does not show it but the curves are not linear,
The complexity is in O(n log n).
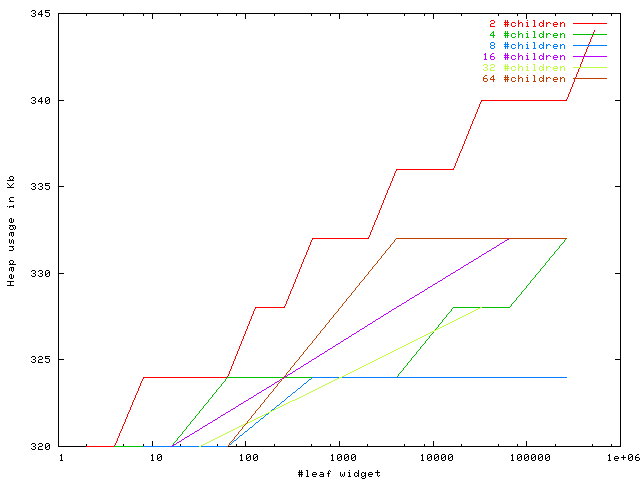
This graph displays the memory (heap) used by malloc/free
by the library.
This used space rise with the number of widgets because
the widget stack must be deeper or larger.
The space used is function of the log of the number of widgets.
The space does not start from 0 because GDK and companion libraries
are used.
This graph displays the stack size used by the running program.
This size is negligible so this graph is a little random...
The stack size is only function of the recursion in user function,
if the application defines the widget tree without functions call
the stack usage will be null.